


Monitoring the COVID-19 Surge Peak in Whatcom County - Update 3

Click to enlarge. .


Monitoring the COVID-19 Surge Peak in Whatcom County - Update 3
Monitoring the COVID-19 Surge Peak in Whatcom County - Update 3
On March 30th, Northwest Citizen published a baseline COVID-19 surge peak forecast I did for Whatcom County. The forecast used March 28th as its launch point. It showed 6,151 total confirmed cases by April 25th, the date that this initial surge will likely peak. While the baseline reflected the social distancing and other containment measures that were proclaimed by Governor Inslee on March 25th, they had not long been in place. As such, the baseline largely represents what could be expected by April 25th in the absence of them. On April 3rd, I provided the first update, which suggested that the social distancing and other containment measures were having the desired effect: The update showed 2,696 total confirmed cases by April 25th, a 56 percent reduction in the number of total confirmed cases. As in the earlier reports, the data for this one comes from the Johns Hopkins University Coronavirus Resource Center.
The second update (April 10th) showed that 1,118 total confirmed cases were expected by April 25th - an 82 percent reduction from the baseline. By comparing the updates to the baseline, it is clear that social distancing and containment measures have been driving down the total number of confirmed cases expected by April 25th. The second update also introduced a model (exponential in nature) more complicated than the simple geometric model used for the baseline and the first update. This was possible because of the longer data history available by April 10th. In the second update, I noted that the more complex model also was used to evaluate the simple geometric model. The evaluation showed that it performed well, confirming its ability to provide reasonably accurate information using the sparse data available at the start of this initial surge, something that more complicated models were ill-equipped to accomplish.
Both the geometric model and its close relative, the exponential model, are designed to capture processes that start slow and then explode, which is what occurs in the initial stages of an epidemic. They are not designed to capture what happens in the later stages as an epidemic slows down as it nears a peak; neither are they designed to show what happens after the peak is reached and we are finally on the downhill side. In order to see what to expect now that we are in the later stages of the initial surge in Whatcom County, I employ a “logistic” model. After it becomes clear we are on the verge of the downhill side (this will likely be the case by the time of the next update), I will employ a “quadratic” model, which can capture the exponential and slowdown aspects of the uphill side of the peak and also show what to expect on its downhill side.
Again, I stress that these models, the logistic and the quadratic, are not well-suited to use in the early stages of the initial surge. The data are too sparse to see that far ahead. Hence, the use of the geometric model in the early stages because it can provide a good view of the path to the peak (but not beyond) with only sparse data to inform it. The primary reason for doing this is that I believe it is vital for people living in counties and small towns to have some idea of what they might be facing, rather than remaining in the dark.
So, how are we doing? The original baseline forecast (the forecast in the absence of containment measures) yielded 6,151 total confirmed cases in Whatcom County as of April 25th, the expected peak of this initial surge. The first update showed 2,296, and the second update showed 1,118. Because no major changes have been reported in terms of testing and identifying changes, the reductions shown by the updates can largely, if not fully, be attributed to the efficacy of the containment measures.
At the time of this writing, the Whatcom County Health Department reports 271 confirmed cases in Whatcom County. However, the Johns Hopkins University Coronavirus website showed 275 as of April 16th and as noted earlier, it is the latter I use here. Staying with one source reduces the threat to consistency in the results of models constructed using different time periods of data. This third update finds that by April 25th a total of 282 confirmed COVID-19 cases is expected, with a 95 percent certainty that no less than 267 and no more than 297 confirmed cases will be reported. You can see a graphic comparison between this update and the baseline at the top of this article.

I used the NCSS statistical package (release 11) to construct the model. This system is built on a Microsoft Excel platform, making it easy to transfer data between NCSS and MS-excel. The computational precision of the NCSS system was tested using the reference data sets provided by the National Institute of Standards and Technology and approved for use by the U.S. Department of Energy (Click here). The technical characteristics of the three-parameter logistic model constructed from the daily confirmed case reports from March 24th to April 17th are shown at right.
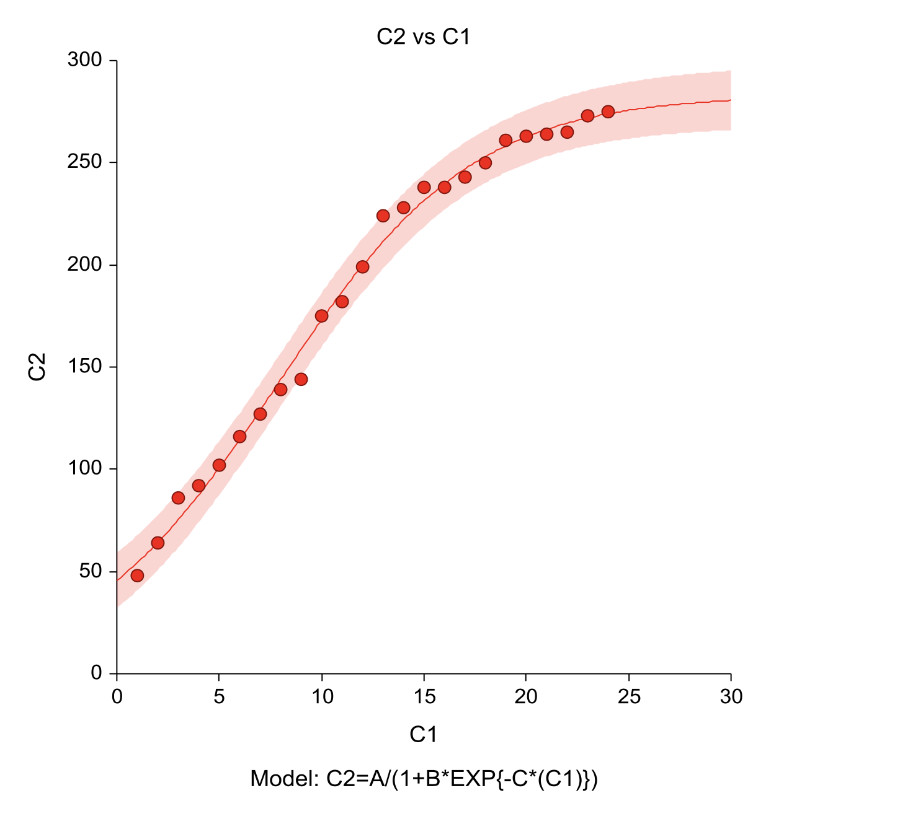
The preceding information supports the view that this model is up to the task. The graph to left shows the fit of the estimated model to the 24 observations (The daily count of cumulative, total confirmed COVID-19 cases) for which there were reported data (the “circles” in the graph) and shows the expected trend beyond the reported cases. Note that the “fit” to the reported data is very good and the expected trend is fairly flat – the model indicates this initial surge is very near to its peak, possibly as early as April 24th or not until April 26th, both of which are very close to the expected peak date of April 25th. Note also the “lumpy data” pattern shown for the reported cases. This largely reflects lags in reporting followed by catch-up “data dumps,” with another source being the reporting of a number of cases suddenly discovered in a group quarters facility (e.g., a nursing home). NCSS is able to deal with this in constructing the estimated model shown above.
Like the earlier updates, this third update brings welcome news, particularly in light of the sacrifices made by the many people who strove to adhere to the containment measures, which included foregoing work and income. These sacrifices are paying a huge dividend in cases averted and lives saved. As of this update, by April 25th, they have brought about a 95 percent reduction in the initial expected number of confirmed cases as shown in the baseline forecast. It is a tremendous achievement that has done a lot to reduce the risk to the first responders, healthcare, grocery, and other workers who on our behalf put themselves at higher levels of risk by staying at essential jobs.

4 Comments